
readApaper#8 Functional Neural Networks in Human Brain Organoids
Reading time: about 6–7 minutes.
Imagine growing a tiny cluster of human brain cells in a dish. The cells begin to fire electrical impulses. But when do many firing cells become a functioning network?
That is the central question of Functional Neural Networks in Human Brain Organoids, a review by Gu and colleagues. Its most useful idea is to study brain organoids at the network level: how neurons connect, coordinate their activity, and change that coordination in disease. The review brings together organoid culture methods, calcium imaging, electrical recordings, and disease-model experiments.
1. Growing neurons is only the first step
A brain organoid begins with human pluripotent stem cells (hPSCs). With appropriate culture conditions, those cells differentiate and self-organize into three-dimensional neural tissue. The resulting tissue can contain neural progenitors, excitatory and inhibitory neurons, and supporting glial cells.
These cell types play different roles. Excitatory neurons help propagate activity; inhibitory neurons, often using GABA signaling, regulate that activity; and astrocytes support the environment in which neural communication takes place. As neurons extend axons and dendrites, they form synapses. Repeated interactions can eventually produce collective patterns such as spikes, bursts, and synchronized oscillations.
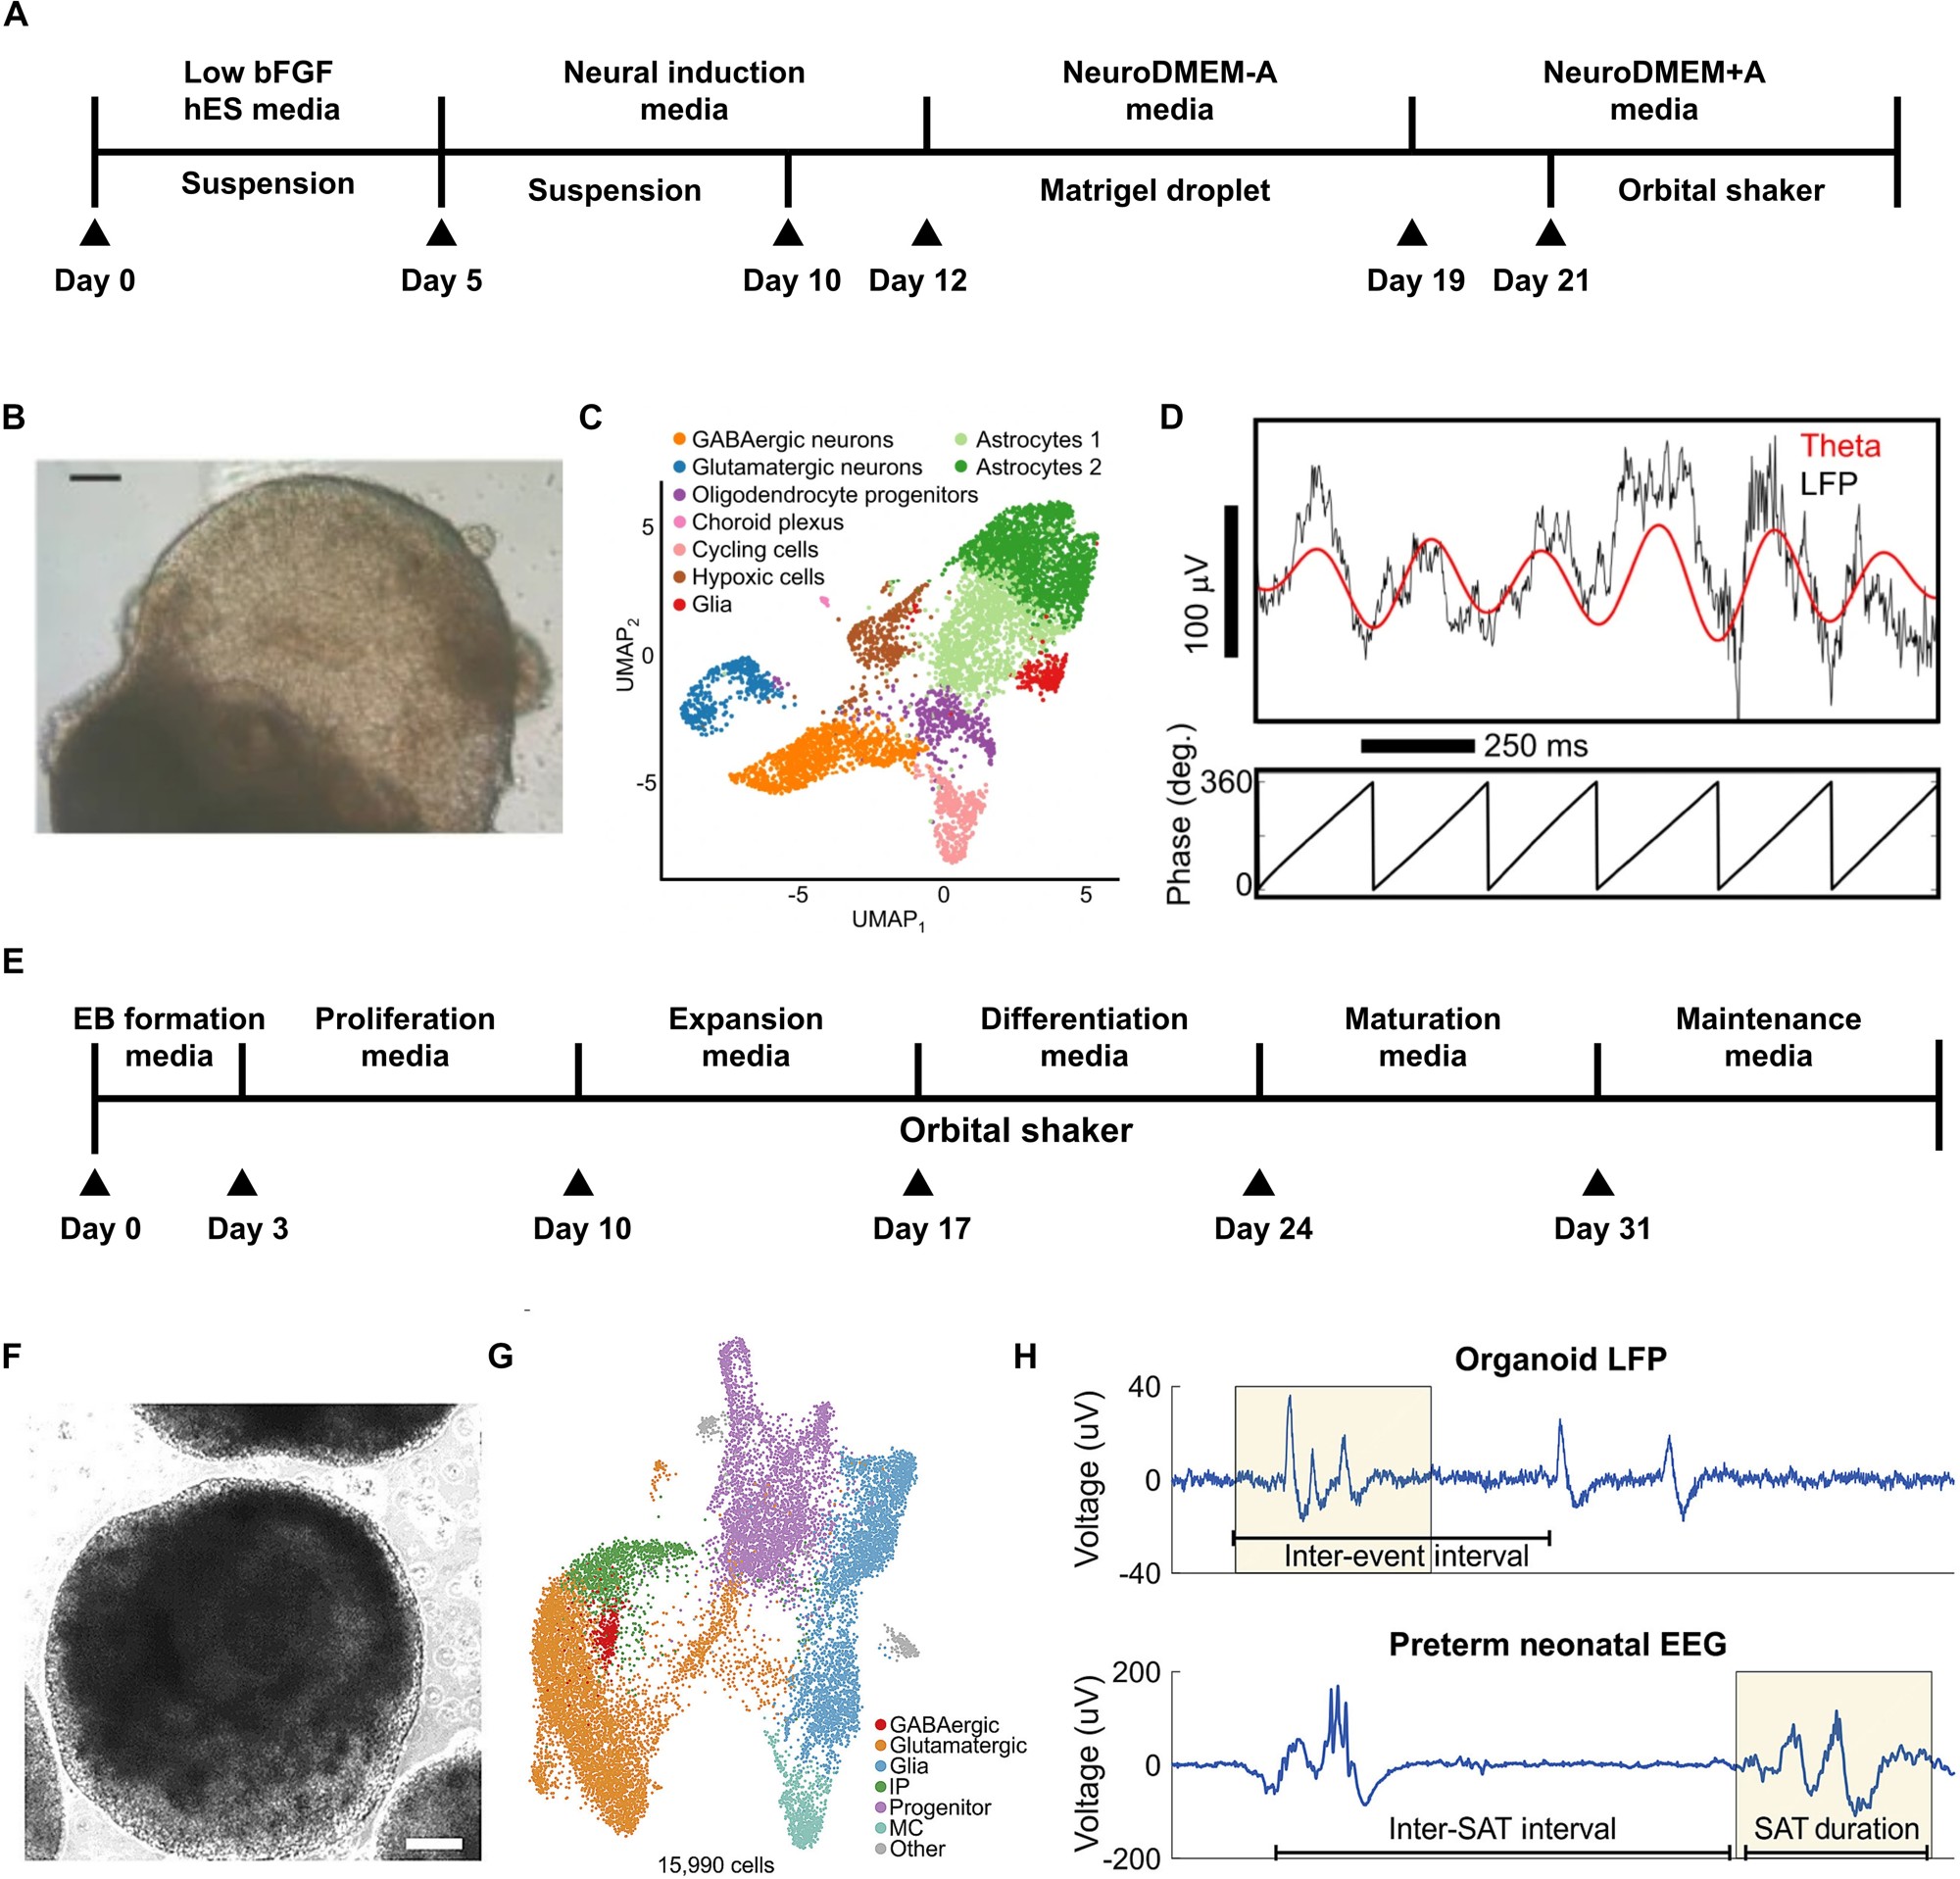
Figure 2. Organoid development, cell types, and the emergence of network activity. Gu et al. (2024).
The review distinguishes two approaches to organoid development:
- Unguided development: cells organize largely through intrinsic programs. This can produce diverse brain-region identities within one organoid, useful for examining interactions among regions.
- Guided development: researchers supply specific small molecules and growth factors to steer differentiation toward a cortical, midbrain, or other regional identity. This offers a more consistent cellular composition for studying a particular circuit.
Over months, activity patterns also evolve. The review describes cortical organoids developing stronger firing, more frequent bursts, and more synchronized events; in an eight-month example, their spontaneous electrical-event timing resembles certain features of preterm neonatal EEG (review Figure 2H). This makes network maturation something researchers can measure rather than judge only from cellular appearance.
2. How do we know the neurons are communicating?
Researchers mainly use two complementary readouts. One watches intracellular calcium changes; the other listens to extracellular electrical activity.
Calcium imaging: watch cells light up
During neural activation, intracellular calcium can change. With fluorescent indicators such as GCaMP or Fluo-4, a microscope tracks each selected neuron’s changing brightness. Researchers commonly express this as ΔF/F, a change in fluorescence relative to a reference level.
Imagine observing 50 neurons. If several fluorescence traces repeatedly rise together, the group has coordinated calcium events. A spatial map can then show which cells tend to activate together. The review describes two-photon imaging experiments tracking calcium events across as many as 1,820 cells in an organoid network.
MEA: listen to electrical spikes
A microelectrode array (MEA) records voltage changes near neurons. Its major advantage is precise electrical timing: researchers can distinguish individual spikes, bursts, and the order of activity across recording sites.
One cited high-density CMOS-MEA system contains 26,400 electrode sites, with up to 1,024 simultaneously recorded channels. Researchers place organoid slices on the array, survey active locations, identify units from extracellular waveforms using a spike-sorting method such as Kilosort2, and then examine relationships between their spike trains.
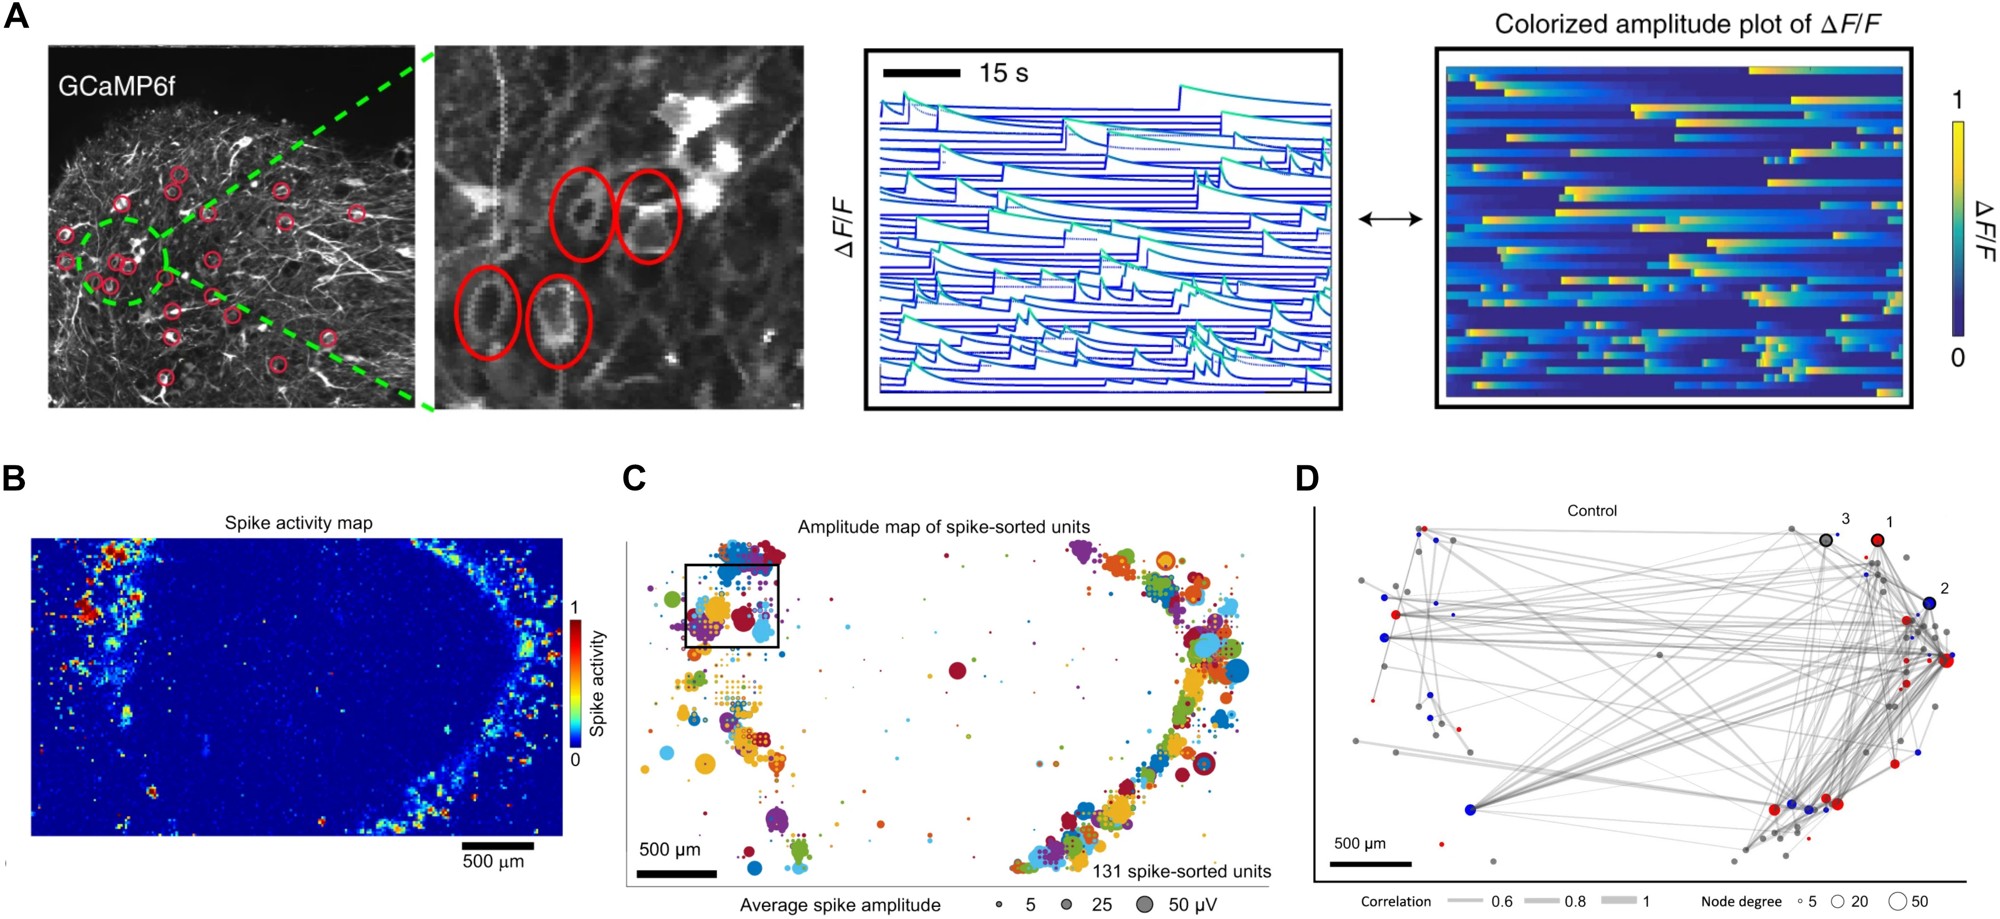
Figure 3. A: calcium activity; B–C: MEA activity and single-unit maps; D: functional connectivity. Gu et al. (2024).
One useful network statistic is the spike time tiling coefficient (STTC). Its purpose is intuitive: ask whether spikes from two units occur close together more often than expected from their firing patterns. Repeat the comparison across many pairs, draw each unit as a node, and connect pairs with strong temporal coordination. The result is a functional connectivity graph.
This yields a practical analysis pipeline:
Raw recording → detected events → single-unit activity / calcium traces → pairwise coordination → network graph.
Instead of asking only ‘How often does an organoid fire?’, researchers can ask ‘Which groups fire together, how does their coordination develop, and how does an intervention reshape the network?’
3. Disease can change the rhythm of an entire network
Network readouts become particularly interesting when organoids are made from patient-derived cells or engineered to carry disease-associated mutations. The review presents two contrasting examples.
Rett syndrome: organoid experiments involving MECP2 mutations reveal large, synchronized calcium transients in cortical–ganglionic eminence fusion organoids. By comparing where the mutant cells were placed within the fused tissues, researchers investigated how altered inhibitory circuitry changes excitation–inhibition balance. The striking observation is excessive collective synchrony (review Figure 4A–C).
Alzheimer’s disease: in a cited study involving PSEN2-associated organoid models, healthy-derived neurons displayed more coordinated calcium events, while Alzheimer’s-associated neurons showed less synchronized activity (review Figure 4D–E). Here, the informative network feature is reduced coordination.
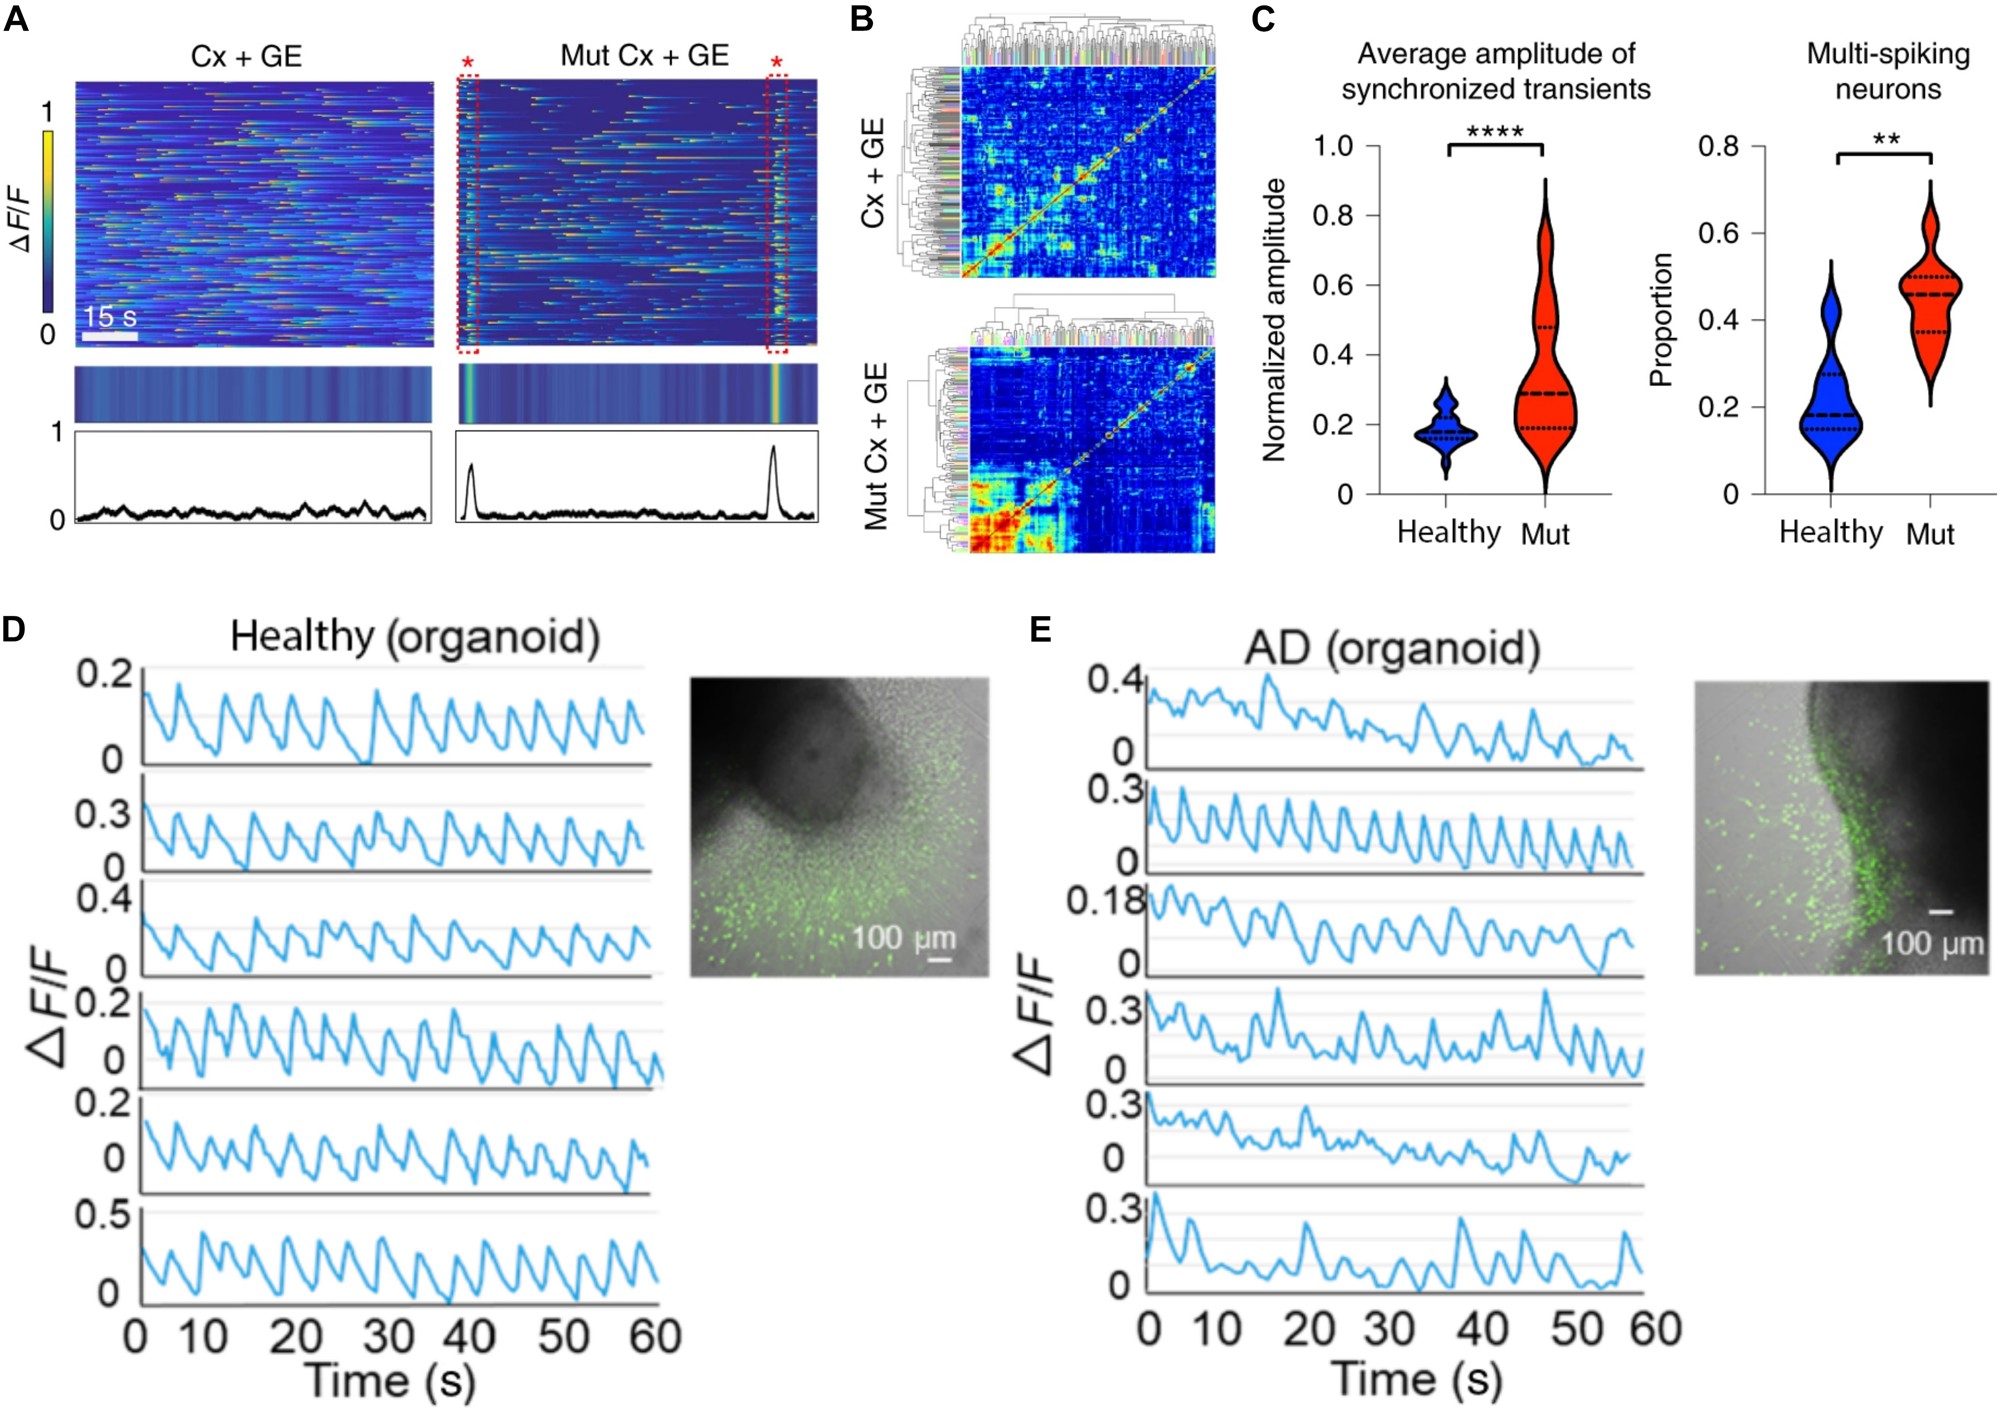
Figure 4. A–C: MECP2-associated hypersynchrony; D–E: healthy and AD-associated calcium activity. Gu et al. (2024).
The important move is from observing a single neuron to measuring a population phenotype: patterns of timing and connectivity reveal how a disease-associated change plays out across a circuit.
4. Why this matters for organoid intelligence
Once a living neural network produces measurable, input-dependent dynamics, it can also become part of an information-processing system.
The ingredients are straightforward: encode information as stimulation → let the organoid network respond → record activity with MEA → decode a useful output. The review cites the 2023 Brainoware work, where electrical inputs to an organoid were processed through its dynamic activity and a trained readout supported tasks such as speech recognition and nonlinear time-series prediction.
For this kind of system, firing rate alone is a small part of the story. Burst organization, response timing, synchrony, and changing functional connections provide a richer description of the network being used as the computational medium. The same measurement language also makes it possible to compare network states before and after stimulation or training.
Takeaway
A brain organoid becomes scientifically interesting as a neural network when its cells begin to coordinate, not simply fire. The review shows how to grow such networks, observe their electrical and calcium activity, and read meaningful differences in their collective dynamics. That is the bridge from a living tissue model to a measurable biological information-processing system.
References / 参考资料
- Gu, L., Cai, H., Chen, L., Gu, M., Tchieu, J., & Guo, F. (2024). Functional Neural Networks in Human Brain Organoids. BME Frontiers, 5, 0065. DOI: 10.34133/bmef.0065.
- Open-access full text (PMC).
- Cai, H. et al. (2023). Brain organoid reservoir computing for artificial intelligence. Nature Electronics. DOI: 10.1038/s41928-023-01069-w.
- Figures 2–4: Gu et al. (2024), CC BY 4.0.
预计阅读时间:6–7 分钟 · 2026 年 10 月 25 日
假设我们在培养皿里养出一团人类脑细胞,其中的神经元已经能够产生电活动。那么,什么时候,一群会放电的神经元才算形成了真正的神经网络?
Gu 等人的综述 Functional Neural Networks in Human Brain Organoids 正是围绕这个问题展开。文章把关注点从“类器官里有哪些细胞”推进到“这些细胞如何连接、同步活动,以及在疾病中如何发生改变”。要理解这篇综述,抓住三件事就够了:网络怎样形成、怎样测量、测到的网络活动能说明什么。
1. 培养出神经元只是第一步
脑类器官(brain organoid) 从人多能干细胞(hPSC)开始。在合适的培养条件下,细胞分化并自组织为三维神经组织,其中逐渐出现神经祖细胞、兴奋性神经元、抑制性神经元,以及星形胶质细胞等。
它们有不同分工:兴奋性神经元帮助信号传播;释放 GABA 等递质的抑制性神经元调节活动强度;胶质细胞维持神经元工作的微环境。神经元伸出轴突、树突,形成突触后,细胞之间就开始发生电化学通信。
随着成熟,类器官会出现几种层次不同的现象:单个神经元产生 spike(动作电位);许多 spike 在短时间内集中形成 burst(簇发);更大范围的细胞呈现时间上协调的活动,即 synchrony(同步性)。这才是从“细胞集合”走向“功能网络”的关键。
图 2|类器官的形成、细胞类型与网络活动的成熟。Gu et al. (2024)。
培养路线主要有两种。Unguided(非定向) 依赖细胞的自组织程序,可能产生多个脑区类型,适合观察不同区域之间的联系;Guided(定向) 借助小分子与生长因子,把细胞引导向皮层、中脑等特定身份,便于研究特定神经回路。
网络活动也会随着培养时间而成熟。综述引用的皮层类器官研究观察到 firing rate、burst frequency 和 synchrony index 的变化;培养约八个月时,一些自发网络事件的时间特征与早产儿 EEG 中的活动瞬变具有相似之处(Figure 2H)。这说明神经网络成熟过程可以通过电活动指标持续追踪。
2. 我们怎么知道神经元正在相互通信?
两种最重要的技术分别是 钙成像(calcium imaging) 和 微电极阵列(MEA)。前者更擅长观察细胞在哪里活动,后者更擅长记录电活动在什么时候发生。
钙成像:看神经元何时“亮起来”
神经元活动往往伴随胞内钙离子浓度变化。研究者使用 GCaMP、Fluo-4 等荧光钙指示剂,让这一过程体现为亮度的变化。常用的 ΔF/F 表示相对于参考荧光水平的变化幅度。
例如同时观察几十个细胞:如果某些细胞的荧光曲线总在接近的时刻升高,说明它们存在协调的活动。进一步统计这些时间关系,就能画出细胞之间的功能连接图。综述介绍的研究曾一次追踪类器官网络中多达 1,820 个细胞的钙瞬变。
MEA:直接听电活动
MEA(microelectrode array) 是一块布满微电极的芯片,能够记录神经元附近的胞外电位变化。我们可以从中分析 spike 的发生时间、burst 的持续过程,以及不同记录点之间的时间关系。
综述提到的一种高密度 CMOS-MEA 具有 26,400 个电极位点,最多同时记录 1,024 个通道。研究者把类器官切片贴在电极表面,扫描活跃区域,再通过 Kilosort2 等 spike sorting 算法识别不同神经元的放电,最后分析各个放电序列之间的关系。
图 3|A:钙活动;B–C:MEA 电活动与单元分布;D:功能连接网络。Gu et al. (2024)。
这里有个很实用的指标:STTC(spike time tiling coefficient)。可以把它理解为:两个神经元的 spike 是否经常在接近的时间出现?把所有神经元两两比较,就得到一个关联矩阵;把神经元画成节点,较强的时间关联画成边,便得到功能连接网络(functional connectivity network)。
因此,实验分析可以概括为一条链:
原始信号 → 检测事件 → 提取 spike train / 钙活动曲线 → 计算同步性 → 绘制网络图。
这样,研究问题就从“类器官能放多少次电”升级为“哪些细胞一起放电、网络如何成熟、刺激后连接关系如何改变”。
3. 疾病会改变整个网络的节律
当类器官来自患者细胞,或携带某种疾病相关突变时,研究者就能从网络层面观察病理现象。综述列出两个很鲜明的例子。
Rett 综合征:异常增强的同步性。 在带有 MECP2 突变的皮层—基底节隆起融合类器官中,研究者观察到大量高幅度、同步出现的钙瞬变(Figure 4A–C)。通过在融合组织的不同组成部分设置突变,还可以研究抑制性神经回路的变化如何影响兴奋—抑制平衡。
阿尔茨海默病:减弱的同步性。 综述引用的 PSEN2 相关类器官研究中,健康来源的神经元能够产生较协调的钙活动,而阿尔茨海默病相关细胞的活动表现出较弱的同步性(Figure 4D–E)。
图 4|A–C:MECP2 突变相关同步活动;D–E:健康与 AD 相关钙活动。Gu et al. (2024)。
两个例子共同说明:疾病表型可以是网络层面的时序关系变化。同样是“有 spike、有神经元”,细胞之间的协调方式却可能完全不同。
4. 这和类器官智能有什么关系?
有了可测量的神经网络动力学,类器官就有机会成为信息处理链路中的一部分。
一个典型链路是:把输入编码成电刺激 → 类器官网络产生动态响应 → MEA 记录输出活动 → 解码器把输出映射成任务结果。 综述引用了 2023 年的 Brainoware 工作:研究者把脑类器官作为 reservoir computing 系统中的动态介质,利用电刺激输入及 MEA 输出,配合读出层完成语音识别和非线性时间序列预测等任务。
理解了这篇综述,再看类器官计算系统,就能多问一步:除了 firing rate,burst、synchrony、功能连接和刺激响应是否也在提供可利用的信息?这些量同时也是追踪类器官训练前后状态变化的工具。
总结
脑类器官的价值不只是培养出能放电的神经元,而是形成能够协同活动的网络。 钙成像告诉我们哪些细胞一起活跃,MEA 告诉我们电信号在何时发生;从这些信号中提取的功能连接,则让网络发育、疾病表型和生物计算拥有了共同的分析语言。
References / 参考资料
- Gu, L., Cai, H., Chen, L., Gu, M., Tchieu, J., & Guo, F. (2024). Functional Neural Networks in Human Brain Organoids. BME Frontiers, 5, 0065. DOI: 10.34133/bmef.0065.
- Open-access full text (PMC).
- Cai, H. et al. (2023). Brain organoid reservoir computing for artificial intelligence. Nature Electronics. DOI: 10.1038/s41928-023-01069-w.
- Figures 2–4: Gu et al. (2024), CC BY 4.0.